A Gentle Introduction to Confidence Intervals

Many job applicants lack understanding of fundamental statistical concepts. In business contexts, data professionals gather information, compute summary metrics, and communicate findings to decision-makers.
Are You Confident Enough in Your Summary?
A critical question emerges: after calculating an average from 500 sessions showing 10 minutes of user engagement, how certain can you be? Potential concerns include:
- Non-representative sampling by coincidence
- Temporal variations (weekends vs. weekdays, day vs. night)
- Insufficient data collection duration
- Unknown thresholds for adequate data volume
Two primary factors influence confidence: "the range of variation in our collected data, and the amount of data collected."
The Data Variance and Standard Deviation
Standard deviation measures data spread. "A low standard deviation indicates that the data points tend to be close to the mean, and vice versa."
import numpy as np

np.random.normal(10, 1, 500)
np.random.normal(10, 3, 500)
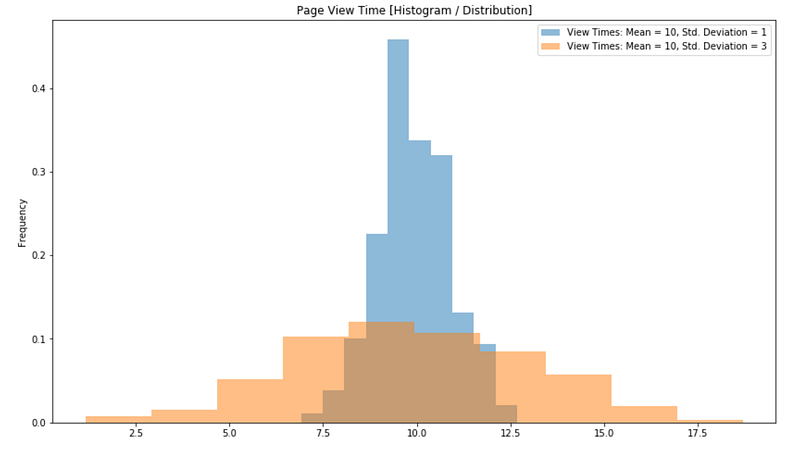
Lower variance datasets warrant greater confidence in their mean estimates compared to higher variance counterparts.
The Size of the Data (N)
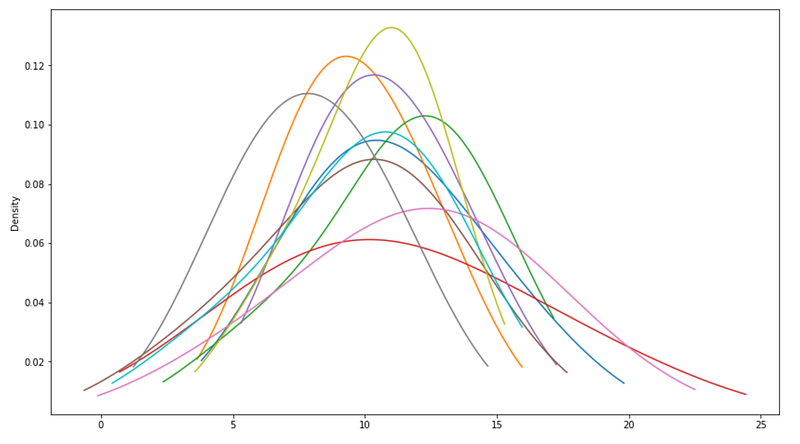
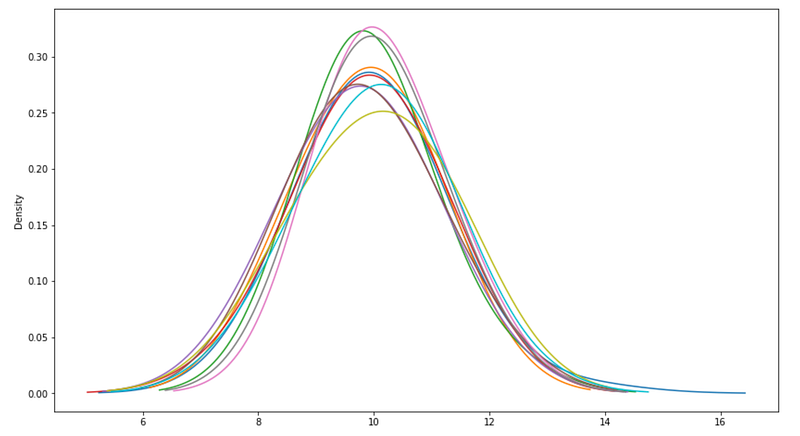
Sample size dramatically affects mean stability. Small samples produce highly variable means, while large samples converge toward population parameters.
import numpy as np
import pandas as pd
import matplotlib as plt

for _ in range(10):
    pd.Series(np.random.normal(10, 3, 5)).plot(
        kind='kde',
        bw_method=1,
        ax=ax
    )
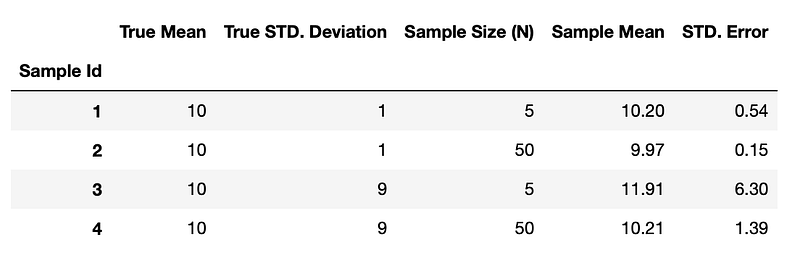
Standard Error
Standard error combines variance and sample size effects:
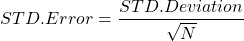
The formula: SE = Standard Deviation / sqrt(Sample Size)
sample1 = pd.Series(np.random.normal(10, 1, 5))
sample2 = pd.Series(np.random.normal(10, 1, 50))
sample3 = pd.Series(np.random.normal(10, 9, 5))
sample4 = pd.Series(np.random.normal(10, 9, 50))
df['Sample Mean'].plot(kind='bar', yerr=df['STD. Error'])
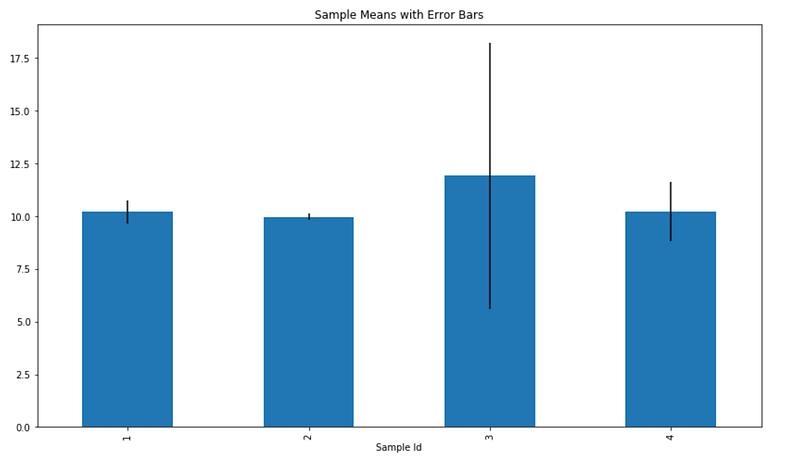
Wider error bars signal reduced confidence in estimated values.
Confidence Intervals
Rather than arbitrarily selecting multipliers, confidence intervals rely on statistical principles. Normal distributions exhibit predictable patterns: approximately 68% of data falls within one standard deviation, and roughly 95% within two standard deviations.
Z-Scores establish confidence thresholds:
- Z = 1: ~68% confidence
- Z = 1.96: 95% confidence
- Z = 2.58: 99% confidence
The 95% confidence interval spans: Mean +/- (1.96 x Standard Error)
T-Scores serve as alternatives to Z-Scores in certain circumstances.
What About Non-Normal Data?
Key takeaway: "Don't worry if your data does not come from a normal distribution, just treat it as if it does and you will be fine!"
The Central Limit Theorem establishes that sample means follow normal distributions regardless of underlying data distribution shapes, provided samples are sufficiently large. However, this principle applies less reliably to medians and quantiles.
Conclusion
Practitioners should prioritize calculating standard error and depicting error bars around summary statistics. While scientific publications regularly employ this practice, business contexts lag behind. Data professionals must either educate stakeholders about interpreting error bars or personally ensure confidence assessments inform their recommendations.
Tarek Amr, April 5, 2021