Kaplan-Meier Survival Analysis
And how this non-parametric approach is used to fit the survival function.
I explained survival analysis in a previous post. If you don't feel like reading another post, here is the gist of it:
When your targets take a very long time to be available for you to model with a Regression Model, you may use the Survival Analysis instead.
In this alternative approach, rather than predicting a point estimate (the target), you predict a function of that target in time (the survival function or survival curve).
The benefit of this approach is that you can use all sorts of premature data to fit your curve, and you don't have to wait for the final point on the curve to be available before building your model.
I briefly mentioned in the previous post that there are various parametric and non-parametric methods for fitting the survival curve. One of these methods is the Kaplan-Meier estimator. Then I was asked to explain it in details in a separate post. So here we are with our new friends, Edward Kaplan and Paul Meier.
But first, let's explain the difference between the parametric and the non-parametric methods.
Note: Feel free to skip to the Kaplan-Meier survival function estimation section if you already know about the Parametric vs Nonparametric Methods
Parametric vs Nonparametric Methods
Imagine you want to model the following:
You have a TV show running on your app, and you want to model how many of your users continue to follow it over time. In the beginning, they all started following the show. Then some of them start to drop over time.
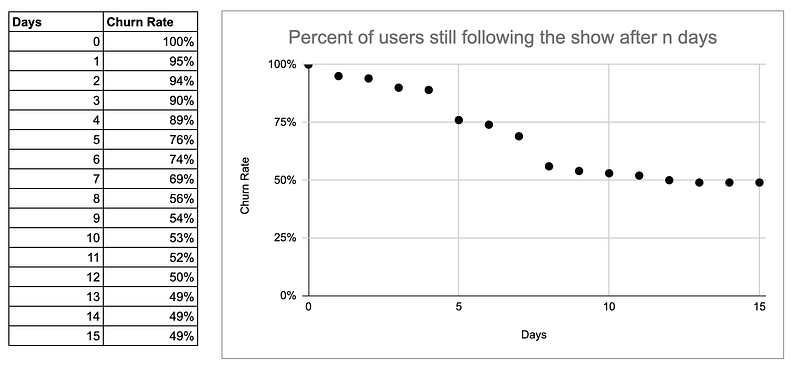
Broadly speaking, to find a function to represent those points above, you can either follow a parametric or a non-parametric approach.
The parametric approach to curve fitting
In the parametric method, you assume that your data points follow a specific shape, which you have to decide on beforehand.
Say, you decide that your data follows an exponential function. You know that this function has certain parameters. Thus, all you have to do is to find the best parameters that give you a curve that is as close as possible to your data-points.
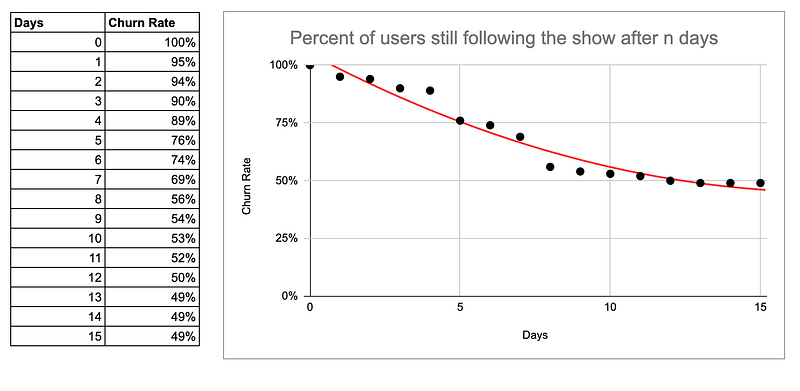
Finding the right parameters is called curve fitting.
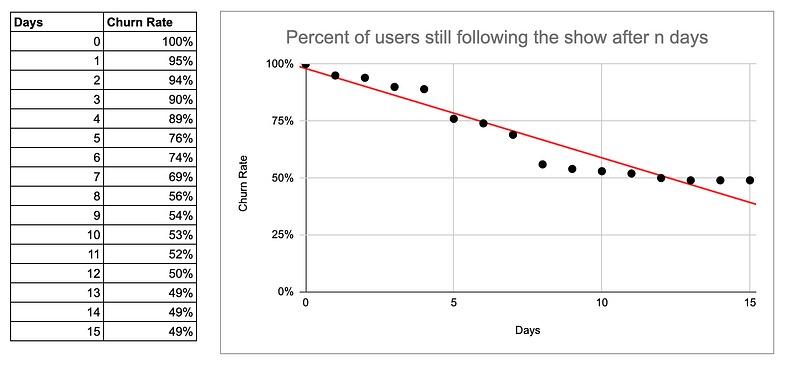
Deciding on a different function with different parameters will result into a different curve. See what happens when a different function is chosen.
(Chart: Another parametric approach for fitting your data points)
Picking the right function is paramount here.
Conversely, making a wrong assumption about the shape of your data can lead to suboptimal results, as you can see below:
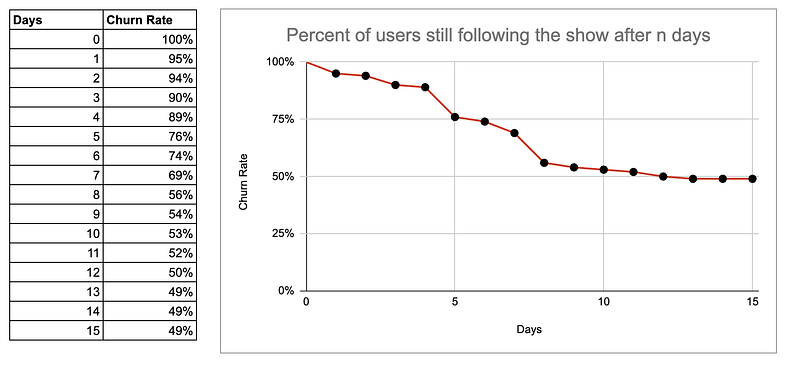
Alternatively, there is the non-parametric approach.
The nonparametric approach to curve fitting
Instead of assuming a specific mathematical formula to describe the relationship between the input and output variables, the non-parametric curve fitting methods directly learn from the data.
Think of it like playing the "connecting the dots" game in magazines, where you plot the data points and draw lines to link them together.
Sounds too good to be true, eh? Why bother with curve fitting when we can just connect the dots?
Well, the nonparametric approach has its drawbacks indeed. It follows the data blindly, a la overfitting. Especially when you have few and noisy data.
In such cases, you may find it helpful to revert to the assumptions of a parametric model to keep your model in check.
But let's stick with our nonparametric models for now; this is where Kaplan-Meier belongs.
Kaplan-Meier survival function estimation
The key point of Kaplan-Meier estimation is that it allows you to construct survival functions for different user groups.
In our example of show watchers, we can't assume all users signed up simultaneously; some joined 6 days ago, others 4, and some just 2 days ago.
How can we create a 6-day survival curve if some of our users have only been there for 4 or 2 days?
Enter Kaplan Meier:
For each transition from one day to the next, we only care about the users who were there before the transition. We then calculate the ratios of users at the end of each transition to those present before it. The product of these ratios yields our survival function at time t, i.e. S(t).
Don't worry if the above is not clear, the next example will make it easy peasy lemon squeezy!
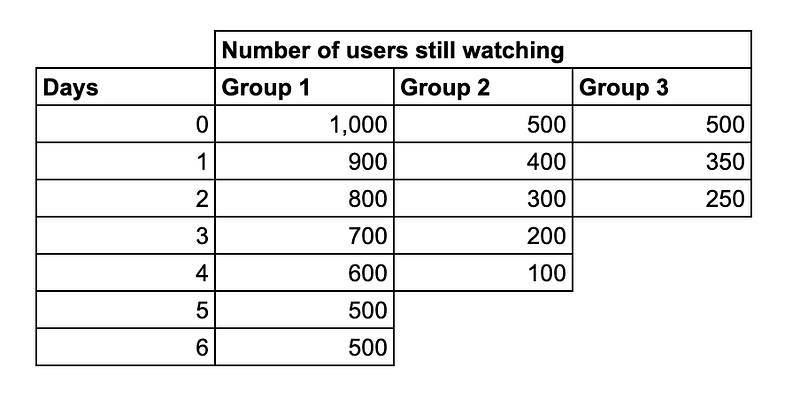
At step zero, we have 2,000 users, from all three groups. And by definition all users are still surviving at time 0, i.e. S(0) = 100%.
Then at step 1, only 1,650 are still there, i.e. 900 + 400 + 350. Then the probability at time 1 is P(1) = 1650 / 2000 = 82.5%. And S(1) = S(0) * P(1) = 100% * 82.5% = 82.5%.
Similarly, at step 2, 1,350 have survived after this transition out of the original 1,650 users before the transition, thus P(2) = 1350 / 1650 = 81.82%. And S(2) = S(1) * P(2) = 82.5% * 81.82% = 67.5%.
Now, step 3 is tricky, group 3 are not part of this transition anymore, none of them joined our platform more than 2 days ago. Thus, we will ignore group 3 in our calculation here. At the beginning of this transition, we have 1,100 users from groups 1 and 2, and after the transition 900 are left. Thus, P(3) = 900 / 1100 = 81.82%. And the survival function at t=3 is going to be S(3) = S(2) * P(3) = 67.5% * 81.82% = 55.23%.
the survival function at t=4 is easy, try it yourself and you will get S(4) = 42.95%. Now, at step 5, once more we have lost another group, thus P(5) = 500 / 600 = 83.33%, and S(5) = S(4) * P(5) = 42.95% * 83.33% = 35.8%. And in case you are curious, S(6) = 35.8% as well, since P(6) = 100%, all users at the beginning of this step stayed till the end.
Which gives us the following survival function in the end.
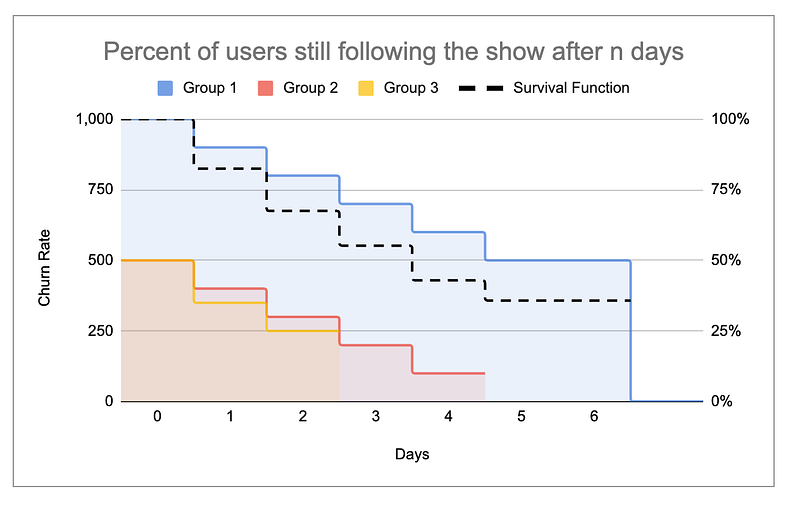
The Kaplan Meier survival curve is usually plotted in the form of a step function. The time is discrete here, and you only know the value of S(t) at those discrete times.
That's it!
For the Pythonistas among you, I recommend the lifelines library by Cam Davidson-Pilon. It's a clean and simple to use library.
And if you are working with a different environment, I also ended implementing Kaplan Meier myself in environments where I could not use lifelines, and it was straightforward to implement as you can see.
Tarek Amr, April 16, 2024